The valley between public perception of crime and official data demands special attention. Last year ended with a heavily reported Gallup polling that spoke to strong nationwide concerns about the state of local and national crime, with a majority of respondents believing that crime was increasing. Many press outlets, criminologists, and commentators pointed out that these public opinion polls conflict with the official data published by the Federal Bureau of Investigations Uniform Crime Reporting (FBI UCR) program, which shows a fairly consistent downward trend.
More confounding still, the FBI’s official annual portrait of crime statistics and the Bureau of Justice Statistics’ Victimization Survey — one of the main alternative measures of crime in the country — appear to provide conflicting information about the movement of crime trends in America since 2020.
Compounding this issue are police clearance rates, the percentage of offenses that police make an arrest and file charges on, which have been trending downwards across much of the United States. Low clearance rates and large underreporting both can encourage crime by reducing the deterrence effect. Prospective offenders may feel emboldened to commit crimes if they feel there is a greater likelihood they will not be reported to the police or if police are less likely to investigate a crime to the point of an arrest. Low clearance rates have a negative impact on public perception of the police and their effectiveness and may further exacerbate the percentage of unreported crimes.
This perfect storm of crime data confusion prompts uncertainty on many levels.
The Government’s Crime Data
Since the 1930s, the gold standard of crime statistics in America has been the FBI’s Uniform Crime Reporting (UCR) data, which collects crime data from law enforcement agencies across the nation and publishes them in September of the following year, after correcting and cleaning data. The publication of the annual UCR report is lags reality anywhere from nine to 18 months depending on the time of year.
These data serve as an estimation and a depiction of crime that has been reported to law enforcement. Included are the eight “index” crimes, four violent index crimes and four property index crimes.
Violent index crimes:
- Homicide
- Rape
- Robbery
- Aggravated assault
Property index crimes:
- Arson
- Burglary
- Larceny-theft
- Motor vehicle theft
These index crimes have historically served as the main indicators of how crime has evolved across the nation.
Unreported crimes represent a missing segment of crime statistics in the UCR. Crimes are unreported for many reasons, from victims who would like to protect the offender from serious consequences to victims who do not want to involve law enforcement or do not feel like it is worth the effort.
Crimes go unreported for many reasons...
Victimization surveys are a meaningful tool to produce another window into crime trends. National victim surveys describe crimes reported and not reported to policing agencies, providing insights into how much crime is not captured in the FBI’s UCR data.
The National Crime Victimization Survey (NCVS) has been conducted by the Bureau of Justice Statistics at the Justice Department since 1973. The NCVS asks survey respondents whether they have been the victim of a crime in the last six months, whether that crime was reported to the police, and the rationale and motivation for not reporting the offense to the police. The NCVS data is built from over 200,000 thousand survey responses. The NCVS data from 2022 is based on responses from almost 227,000 persons from almost 144,000 households.
Different crimes have different degrees of underreporting. Auto theft, which involves insurance companies and necessitates a burden of proof demonstrated through official channels, tends to have low underreporting. There are other crimes, like sexual assault and larceny (the most common crime reported by UCR data), that have a much greater likelihood of going unreported to law enforcement and thereby likely to be underrepresented in official data.
Disagreements between official measurements
There are meaningful differences that make direct comparisons of these statistics difficult. NCVS data also does not mark the same calendar year as the UCR data. The survey asks people whether they have been victimized in the last six months, and thus the 2022 survey program captured crimes that occurred from July 1, 2021, through November 30, 2022. While large overall trends in American crime — like the long-term reduction of the violent and property crime rate over the last three decades — are not altered by this timestep, it is possible, particularly if there are unique and extenuating circumstances that individual types of crime look different.
Neither UCR nor NCVS present themselves as a comprehensive statistic on crime, but instead an estimate and representation of crime trends. Generally, they report the same large-scale trends in violent and property crimes. For instance, both have shown long-term reductions in both violent and property crime over the last 30 years. But reporting for the years since 2020 has had these two indicators presenting apparently conflicting information.
…highlights an increasing discrepancy in the percentage change of total violent crimes…
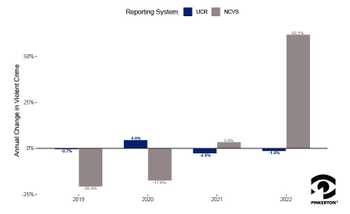
Analysis by Dr. John Lott at the Crime Prevention Research Center highlights an increasing discrepancy in the percentage change of total violent crime rates. While the percentage change in rates of crimes reported to law enforcement according to NCVS and UCR are rarely in agreement, the discrepancy in most years from 2008 to 2018 is in single digits. However, from 2019 to 2022, the difference in percentage change of violent crimes reported to the police is consistently in double digits. In 2020 and 2022, Lott found a difference of about 30 percentage points. This wide gap creates more uncertainty about the actual movement of violent crime trends.
In his analysis, Lott used the NCVS rate for total violent crime reported to the police, which includes simple assault. While the FBI UCR program does collect data on simple assault, it is not one of the four index crimes used to produce the aggregate violent crime rate. The NCVS also publishes a violent crime rate excluding simple assaults, facilitating a nearer comparison, and when using this figure, the percentage changes in crime rate are even more dramatic (see below). This is still not an apples-to-apples comparison of aggregate violent crime because the NCVS does not capture data on homicide, the rarest violent crime, as the survey asks respondents if they personally have been the victim of a crime.
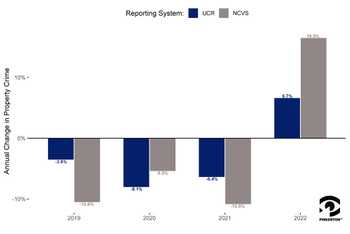
The figures below show the annual percentage change in aggregate violent crimes (excluding simple assault) and property crimes reported to the police since 2018 according to UCR and NCVS.


The saliency of the FBI’s data in 2021 was called into question to a degree previously unseen. The transition from the Summary Reporting System (SRS) to the National Incident-Based Reporting System (NIBRS) was not adopted as universally as the FBI intended. This meant that official crime data describing 2021 was more interpolated than FBI data intended.
According to the FBI, program participation has subsequently improved, and the 2022 and the forthcoming 2023 are more accurate than the 2021 data.
Clearance Rate
A clearance rate is the percentage of crimes reported to the police that result in an arrest and charges filed.
Clearance rates are going down among crimes reported to police, possible mechanisms include significant numbers of retiring police and/or challenges to police recruitment. Nationwide significant numbers of low confidence in the police also reduce witnesses providing useful information after a crime has occurred. In a Manhattan Institute report discussing the disparity between clearance rates of urban gun crimes, American Criminologist Anthony Braga describes low confidence in police and stigma against cooperation in neighborhoods resulting in lower clearance and arrest rates.
There is the potential for a vicious cycle where low confidence and low cooperation create a greater likelihood that victims of crime will not contact the police, thereby exacerbating underreporting.
…clearance rates have decreased across all index crimes…
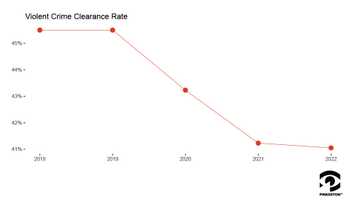
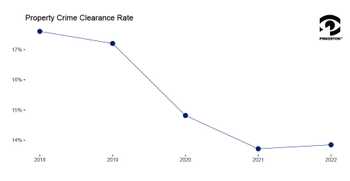
According to UCR publications, clearance rates have decreased across all index crimes. The clearance rate for all violent crimes dropped by 4.45% from 2018 to 2022. The clearance rate for all property crimes dropped by 3.75% from 2018 to 2022.


Homicides and aggravated assaults receive a greater deal of resources and attention from police departments and have a higher clearance rate than other crimes. Unfortunately, these clearance rates have declined even more dramatically, 2022’s homicide clearance rate was almost 13% lower than the 2018 rate. Aggravated assault’s clearance rate dropped more than 10%.
These changes impact the deterrence effect, adding a wrinkle to the routine activities theory understanding of crime. frequently espoused in this blog (Read HERE and watch HERE). Routine activity theory states that crime occurs in the confluence of a motivated offender, a suitable target, and capable guardianship. If potential criminals are more confident that their offenses will not be reported to the police and more confident that if these crimes are reported to the police they will not be arrested, there is a stronger motivation to offend, inviting all entities concerned with risk to reevaluate their own target suitability and guardianship capability.
Pinkerton Crime Index: Innovation and Accuracy in Crime Risk Scores
While frequently used crime statistics rely either solely on police agency-level data or the FBI’s UCR data, the Pinkerton Crime Index blends information coming from the UCR, the National Victimization Survey, local agency crime data, and a number of other community data inputs, providing a measure of crime raw that cuts through the cloudiness found in raw crime data alone. As we enter new phases of crime data, in which we see divergences in national crime statistics, the Pinkerton Crime Index offers an innovative measure of crime risks that is objective and accurate and circumvents the shortcomings found in these other measures.
Braga, Anthony A. “Improving Police Clearance Rates of Shootings: A Review of the Evidence.” Manhattan Institute. July 2021.
https://media4.manhattan-institute.org/sites/default/files/improving-police-clearance-rates-shootings-review-evidence-AB.pdf
Bureau of Justice Statistics, National Crime Victimization Survey, 2022.
Jones, Jeffrey M. “More Americans See U.S. Crime Problem as Serious.” Gallup. 11/16/23.
https://news.gallup.com/poll/544442/americans-crime-problem-serious.aspx
Lott Jr. John R. “How reliable are the FBI’s Report of Violent Crime Data? There are some major problems.” Crime Prevention Research Center. 4/20/2024. https://crimeresearch.org/2024/04/how-reliable-are-the-fbis-report-of-violent-crime-data-there-are-some-major-problems/
United States Department of Justice, Federal Bureau of Investigation. (February 2024). Crime in the United States, 2022.


