Measuring crime risk in any country is uniquely challenging. When we set out to produce a meaningful assessment of crime risk in Mexico, we quickly encountered severe underreporting in the Official Crime Statistics. Because these data are a key ingredient to our final crime index, we had to incorporate many data sources and statistical processes to correct for this underreporting. These efforts resulted in the most valid portrait of crime risk available.
In Mexico, the percentage of crimes reported to and investigated by law enforcement is a relatively low percentage of total crimes that have occurred. This means that the official crime statistics published by the Mexican government are an imperfect representation of actual risk.
Victimization surveys improve crime data
Victimization surveys are a particularly valuable tool to check against official law enforcement numbers. In Mexico, the National Institute of Statistics and Geography (INEGI) runs a yearly victimization survey. These surveys help to capture true quantities of major crime types, excluding homicide, through scientific sampling of over 100,000 households across more than 1,700 municipalities. These surveys gather data on whether sampled households were victimized by crime and whether these crimes were reported to, or investigated by, law enforcement agencies. Like official crime statistics, victimization survey data are imperfect with respect to comprehensive coverage of all municipalities but are nonetheless invaluable in providing an understanding of crime beyond official reports.
INEGI uses victimization surveys to determine the share of crime missing from official statistics. This number is referred to as the “cifra negra” or “black number.” Using 2019 data as an example, only around 10% of total crimes were reported to law enforcement. Of these reported crimes, about 70% are actually investigated by the authorities. This means that a remarkable 90% of victimization events go missing from official crime statistics.
Underreporting is relatively consistent over time, but it is heterogenous across municipalities. This means that the level of crime reported and investigated tends to be similar from year-to-year, but differs dramatically across space. Some states have a black number as low as 84.5% where others are as high as 96.1%.
The "black number" and crime type
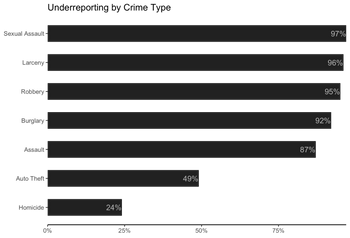
The black number also varies by crime type. Motor vehicle theft is reported more consistently than other types of larceny. This is likely because car insurance policies mandate official channels for a claim to be honored. Homicide, a relatively rare and serious offense, is reported more consistently than assault. The figure below shows the black number estimated for each crime type – that is, the percentage of total offenses not officially recorded.

Pinkerton data scientists undertake several other steps to produce a more valid picture of crime risk relative to official statistics.
Though homicide is better reported compared to other crime types it is still underrepresented in official crime statistics and is absent, of course, in victimization surveys. To address this, Pinkerton data scientists utilize death certificates, also maintained by INEGI, to help determine the black number concerning homicide. Death certificates list both a cause and a mechanism for death. Cause can be listed as homicide, as well as other causes such as Suicide, Accident, or Unknown. Analyzing death mechanism and other details, including the age of the deceased and location of death, Pinkerton data scientists build statistical models that conservatively classify deaths as “Likely Homicide” or “Unlikely Homicide” from death certificate data. For instance, out of 25,908 deaths classified as Unknown, the model classified an additional 6,981 events as "Likely Homicide." Deploying similar statistical methods, our data scientists also leverage government data on involuntarily “disappeared” persons to capture additional uncounted homicide events.
How innovative data capture improves understanding
Death certificates and victimization surveys help analysts to fill in data gaps regarding the underreporting of crime, but not all 2,454 municipalities in Mexico are sampled in high enough quantity in victimization surveys. To capture risk in under-sampled municipalities, data scientists build comprehensive statistical models identifying shared traits and characteristics with similar areas with more robust data available. With these models, Pinkerton data scientists can estimate realistic black numbers for municipalities under-sampled in victimization surveys.
Finally, Pinkerton data scientists use pairwise comparison surveys to collect feedback from local risk professionals regarding crime risk and corruption across areas in Mexico. This collective wisdom from risk management professionals helps refine our statistical models – a characteristic blend of science and on-the-ground experience that distinguishes Pinkerton from rivals.
The Pinkerton Crime Index is more than just regurgitation of official crime statistics – it’s the combination of innovative data technology and expert insights from real-world risk professionals, delivering a deeper understanding of crime risk in your area that you can count on. Check out the Pinkerton Crime Index to learn more.


