How does one measure total crime in a neighborhood? Do you simply add all the crimes that occurred? Should an assault be equivalent to a minor theft?
Extracting insights from cumulative crime counts is a source of difficulty that can lead to misunderstanding and misinformation. High-volume yet relatively minor crimes such as shoplifting dominate crime counts, while severe offenses such as sexual assault and homicide are relatively rare. Risk scores built from a cumulative sum of offenses will imperfectly capture a community’s risk, merely reflecting the crimes of greatest frequency.
While most people appreciate differences in severity between a crime involving violent victimization as opposed to lesser non-violent offenses, a challenge exists when viewing safety and risk across all crime types. An opportunity for confusion and distrust is created when, for instance, popular media outlets report an overall reduction in crime, while simultaneously reporting an increase in homicide. Compared to most other crime types, homicide is rare, but the grief and trauma that cuts through a community, regardless of actual exposure, carries severe societal cost. A larceny, on the other hand, is quite common and the resulting costs are often relatively minor by comparison. Because larcenies have a much greater frequency, simply adding homicide counts and larceny counts results in homicides playing a minimal role in the final total of index crimes.
A crime index that is calibrated to the societal costs of crime should aim to account for differences in both frequency and severity when summing across crime subtypes.
Severity weighting reflects crime risk
The Pinkerton Crime Index is constructed utilizing the concept of a “severity weight”. Severity weights are constructed using the relative difference in average prison sentence lengths for each crime subtype. Crimes that result in longer prison sentences get a larger weight relative to more minor crimes. Applying these weights results in a final total crime index that reflects both the frequency and severity of each crime type.
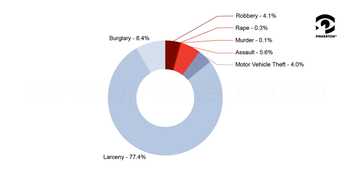
As an example of severity weighting put into practical use, below are two graphics illustrating breakdowns of criminal offenses in Cook County, Illinois (Chicago). The first graphic is composed of aggregate crime totals, where overall counts are dominated by Larceny, and severe violent offenses are a small fraction of total crime.

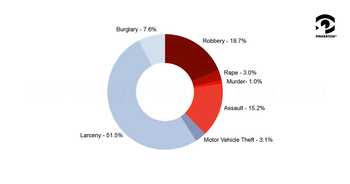
The second graphic demonstrates Cook County’s crime data after severity weighting has been applied. While the new breakdown still accounts for Larceny’s higher frequency as compared to other crime types, severe violent crimes have a more meaningful impact in the total risk score.

The Pinkerton Crime Index intelligibly combines different types of crime to portray a more meaningful representation of crime risk. Other crime indices, which rely purely on crime counts, are over emphasizing the importance of minor crimes. The use of severity weighting in the Pinkerton Crime Index instead captures the frequency and severity of all crime types, resulting in a more realistic depiction of total crime risk.
Visit Pinkerton Crime Index today to request a sample report and learn more about the tools at your disposal.


