Weather and disaster experts are bracing for an active tornado season in 2025. As of mid-April, the United States experienced over 470 tornadoes, double the historical average for that time of year.
Running ahead of tornado season, storm activity has concentrated heavily on Mississippi, with nearly 100 storms counted by mid-April. Last year, Mississippi had only seven tornadoes by the end of March.
Missouri and Illinois have also been impacted by high early-season activity, both with more than 50 storms as of mid-April. According to the National Centers for Environmental Information (NCEI), the 25-year average for all three states is 49-50 storms per year.
When and Where Tornadoes Strike
The period between April and July is commonly recognized as tornado season, but there has been increased out-of-season activity. According to the NCEI, the 2020-2025 seasons have all shown higher than average pre-season activity. In 2021, tornado activity after the standard tornado season was twice as high as the 25-year average and resulted in 91 fatalities.
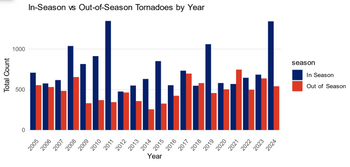
The plot below demonstrates the relationship between total tornadoes recorded in the traditional April through July season and the tornadoes recorded during the rest of the year.

In years of low in-season activity, the rest of the year experienced almost equal (and in the case of 2018 and 2021, greater activity) than the traditional tornado season.
Tornadoes are mostly concentrated in an area colloquially known as Tornado Alley. It doesn’t have firmly agreed-upon boundaries, but it captures the American Midwest and some of the Southeast. Some definitions of Tornado Alley include Florida and most of the South, or as far west as Colorado’s eastern plains.
The Impact of Tornadoes on Infrastructure
The severity of tornadoes is determined by the Fujita Tornado Damage Scale, which uses wind speeds and types of damage to categorize tornadoes. Forty percent of recorded tornados are categorized as F1, indicating wind speeds ranging from 73 to 112 miles per hour, and are characterized with moderate damage that includes overturned automobiles, trees uprooted, and structures like carports being destroyed. Twenty-four percent of tornadoes are F2, where wind speeds can reach 157 mph, and roofs can be blown off buildings and mobile homes overturned.
Like other types of extreme weather events, the costs of damage associated with storms has grown more costly in the 21st century. Six out of the ten costliest storms in U.S. history have occurred since 2011. The costliest storm occurred in Joplin, Missouri in late May of 2011 and produced almost 4 billion dollars of damages when adjusted for inflation. More recently, a tornado striking Nashville, Tennessee in March of 2020 produced almost 2 billion dollars of damage.
Tornadoes are associated with extensive property damage as well as damaging crops. Tornadoes can also disrupt local power supply, damage roads, and produce a multitude of barriers to business continuity. The expansion of tornado risk beyond the traditional tornado season highlights the importance of risk awareness and corporate disaster response strategies.
Natural Disaster Risk Insights by Pinkerton
Pinkerton Risk Pulse provides local insights on natural disaster risk for tornadoes and other hazards, facilitating informed decision-making. Pinkerton disaster response services can also help firms and communities seeking to restore business continuity and a sense of normalcy after natural disasters.
SOURCES
Ferrell, J. (2025, April 14). Tornado outbreaks dramatically accelerate 2025 season; one state stands out. https://www.accuweather.com/en/severe-weather/tornado-outbreaks-dramatically-accelerate-2025-season-one-state-stands-out/1763820
NCEI.Monitoring.Info@noaa.gov. (n.d.). U.S. tornadoes. U.S. Tornadoes | National Centers for Environmental Information (NCEI). https://www.ncei.noaa.gov/access/monitoring/tornadoes/
The 10 costliest U.S. tornadoes (1950-2022). 10 Costliest U.S. Tornadoes. (n.d.). https://www.spc.noaa.gov/faq/tornado/damage$.htm
US Department of Commerce, N. (2015, March 28). Fujita Tornado Damage Scale. National Weather Service. https://www.weather.gov/iwx/climatology_fscale#:~:text=MINIMAL%20DAMAGE%3A%20Some%20damage%20to,shingles%2C%20trees%2C%20and%20windows.&text=MODERATE%20DAMAGE%3A%20Automobiles%20overturned%2C%20carports%20destroyed%2C%20trees%20uprooted.&text=MAJOR%20DAMAGE%3A%20Roofs%20blown%20off,outbuildings%20demolished%2C%20mobile%20homes%20overturned.&text=SEVERE%20DAMAGE%3A%20Exterior%20walls%20and%20roofs%20blown%20off%20homes.


