In the United States each year on average, more than 100,000 wildfires clear four to five million acres of land. However, last year wildfires burned more than 10 million acres. And already this year, fires have consumed more than five million acres, with many still burning uncontained. Fires spread quickly due to many factors including drought-conditions resulting in dry, highly-combustible vegetation. But one of the biggest factors is wind.
Even mild winds can carry still-hot embers many miles away, igniting new fires outside the containment zones. The wildfire risk this presents to people and facilities is far-reaching. It was because of this that Pinkerton Managing Director David Davari and his team set out to help a healthcare client predict which of their facilities were most at wildfire risk during the 2017 fire season in Northern California. Knowing which way the wind was blowing was a key element.

Dashboard of predictability
“When we arrived at our client’s command center during the Sonoma and Napa fires, we could see immediately that information was being gathered very quickly,” said Davari. “However, they needed to centralize the data into some useful form so that they could prioritize their emergency response.”
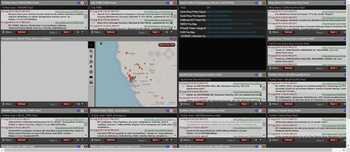
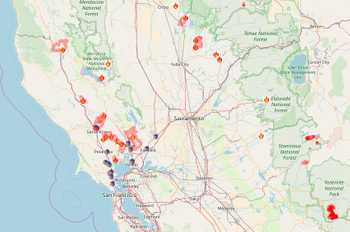
Davari and the team developed a dashboard interface through which multiple news and update sources could be monitored. The dashboard included a map of all the facilities at wildfire risk with an overlay showing wind speeds and direction. This proved to be extremely valuable information.
“Knowing that wind speeds were picking up in a certain region and from which direction they were blowing allowed us to recommend that certain facilities initiate evacuation protocols while others could stand down for the time being,” Davari said. “If we hadn’t been monitoring this information in real time, those procedures might have been started too late, resulting in injuries or even deaths.”

Managing the variable risks of wildfires
The primary concern during the wildfires was the safety of personnel, patients, visitors and guests to the company’s facilities. The dashboard helped determine how best to allocate security teams so that they could all be kept safe and moved away from the fires’ paths. There were then variable risks to take into account as the fires impacted physical and operational business elements.
“The fires didn’t just impact people,” Davari explains. “The disruption to normal business created continuity issues regarding how the company could service its patients in the short and long terms. Supply chain routes were destroyed or cut off, creating logistical issues that had to be mitigated. And the brand’s reputation was also at stake, since mishandling any aspect of the emergency plans could create a negative public perception of the company.”
While some of the damage done by the fires could be recouped through insurance claims, loss of property due to looting could not. It was important that Davari and his team understand which facilities were most at risk. “Unfortunately, looting was a real possibility since it was happening at other companies’ facilities around the fire areas. This risk can really have a big impact on a facility’s bottom line. Using the dashboard and on-the-ground intel we gathered, we could deploy security teams to create a presence at vulnerable facilities to deter theft activities.”
Incident response support, like the dashboard create for the California wildfires, is just one way in which the Applied Risk Science methodology is helping companies predict and mitigate wildfire risks. “It’s important that companies understand that data like this can be used long-term and not just for incident response. Enterprise-wide, data-driven risk assessments can be an instrumental tool for budgeting, planning and business continuity.”


