Reports show where risk exists, in what forms and to what degree
Pinkerton, a global provider of comprehensive risk management services, has launched the Pinkerton Risk Index Report, a revolutionary new tool to help business leaders worldwide identify where, how and to what degree risk exists in every country around the world and every state in the U.S. Pinkerton President Jack Zahran made the announcement.
The Pinkerton Risk Index Report takes into account 83 different underlying variables that correlate to critical business risk areas, such as natural disasters, infectious disease, terrorism, economic structure, societal upheaval, and information and technology, and determines how prevalent each risk is in a certain country. Through the use of big data analysis and econometric methods, Pinkerton is able to assign every country with a Risk Index Score. Business leaders can leverage these scores to compare the risk levels of different countries to make better-informed decisions when it comes to relocations, expansions, investment and business travel.
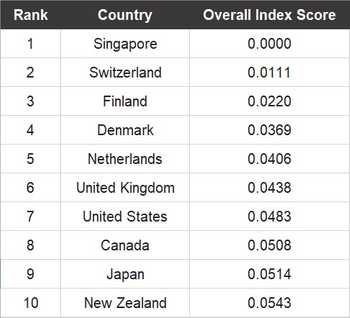
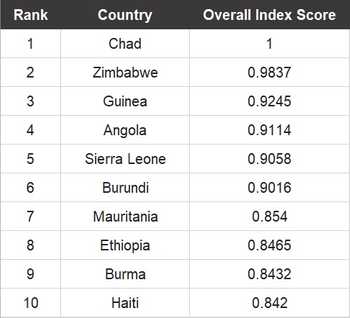
To help illustrate the power of the global Pinkerton Risk Index Report, the following tables show the top 10 countries in the world in terms of least and most overall risk. More than 160 countries are represented in the full Pinkerton Risk Index Report:
The need: “The world is more connected than it has ever been,” said Zahran. “We are living in a true global economy where risk and performance is interdependent. We developed the Pinkerton Risk Index to help our existing and future clients better understand the risks that exist in both the places that they are currently operating as well as those areas that they are considering for expansion. Risk management is no longer an insurance policy, its day-to-day reality.”
Least Overall Risk:

Most Overall Risk:

Reading the Report: The Pinkerton Risk Index Report was created through years of collaborative work by scholars and security professionals and is backed by data from 17 national and international organizations. Big data analysis allows Pinkerton to evaluate risk in the context of importance, insurability and information reliability to create an “index score” for each country. For comparison’s sake, the country with the best index score was given a baseline score of 0.000, while the country with the worst rank was given a score of 1.0000. A score of 0.0000 doesn’t necessarily mean that no risk exists in that country, instead it means that the country has the least amount of risk relative to the countries included in any given dataset. Countries with low amounts of overall risk typically share common characteristics like sophisticated economies, strong institutions, quality supply chains, low prevalence of organized crime, commitment to property rights, and freedom from corruption.
The Pinkerton Risk Index Report builds on a concept created by Pinkerton called the Risk Wheel, which breaks down risks that threaten business organizations into four primary categories: Hazard & Event Risk, Operational & Physical Risk, Technology & Informational Risk, and Market & Economic Risk. The Risk Wheel primarily illustrated that organizations need to take a holistic approach to risk management that accounts for risks in all four categories. The four quadrants of risks are connected and if business leaders focus their efforts on only one category, they leave themselves exposed to risks from other categories. The Pinkerton Risk Index Report proves this hypothesis and can be viewed through the lens of any one category in the Risk Wheel, through multiple categories, or through all categories combined as overall risk.
Taking a deeper dive: For more in depth information about the Pinkerton Risk Index Report, how it was created and the mathematical formulas used to build out the rankings, please see the full Pinkerton Risk Index Report here.
Pinkerton has also created an interactive dashboard that literally illustrates the results of the Pinkerton Risk Index Report. The dashboard features a global map that is color-coded to show overall risk levels in every country around the world, with blue indicating lower levels of overall risk and red indicating high levels of overall risk. Users can also drilldown into individual countries to see how they perform in 11 key areas of risk assessment, including natural disasters, business operations risk, economic structure risk, societal upheaval risk, and information technology risk.
